Using Zig to Provide Stack Traces on Kernel Panic for a Bare Bones Operating System
Last week, I reached an exciting milestone in my career as a programmer. For the first time in my life, I ran code directly on hardware, with no Operating System sitting between the bare metal and my code.
For some context, the goal of this side project is to create a 2-4 player arcade game running directly on a Raspberry Pi 3+.

Having just gotten Hello World working, this software can do little more than send a message over the serial uART on bootup:
Hello World! ClashOS 0.0
So what's the next step? Bootloader? File system? Graphics?!
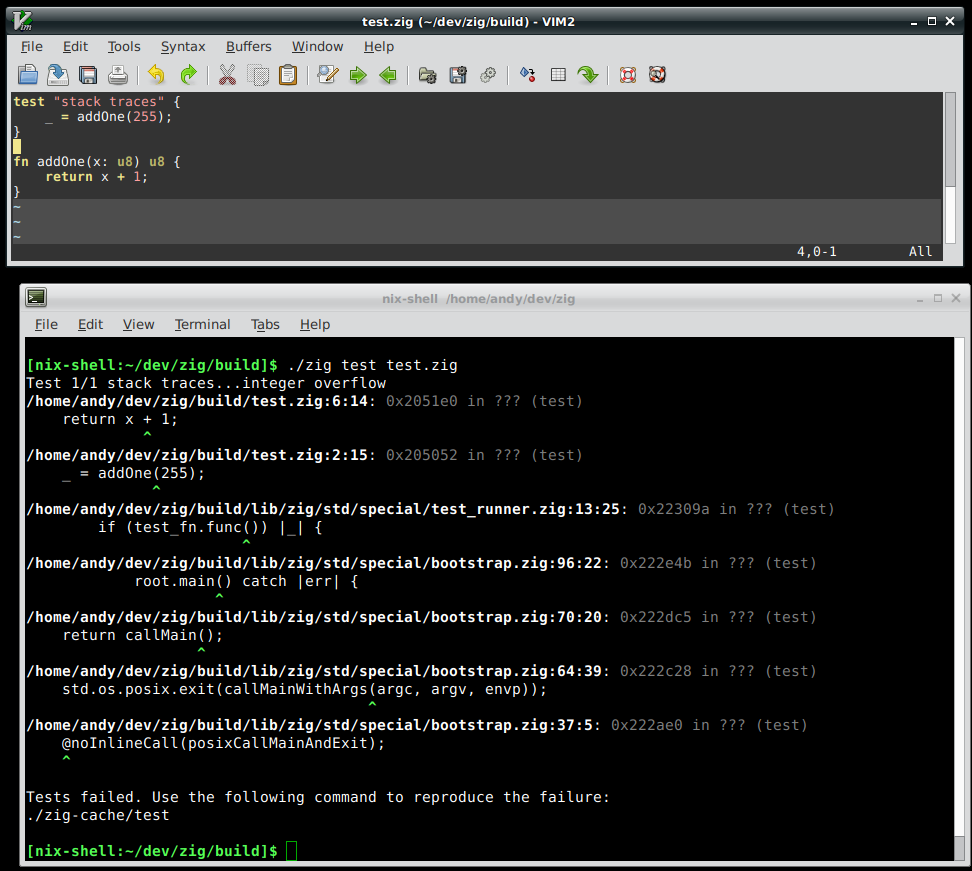
Well, when coding all of these things, I'm inevitably going to run into bugs and crashes. And when this happens, I want to quickly understand what's gone wrong. Normally, in Zig, when something goes wrong, you get a nice stack trace, like this:

This example, however, is targeting Linux, whereas this arcade game project is freestanding. The equivalent code in freestanding actually just hangs the CPU:
--- a/src/main.zig
+++ b/src/main.zig
     serial.log("Hello World! ClashOS 0.0\n");
+    var x: u8 = 255;
+    x += 1;
+    serial.log("got here\n");
When run, you'll see we never get to the "got here" message, but also we don't get any kind of error message printed or anything.
Hello World! ClashOS 0.0
To understand this, we can look at the default panic handler.
In Zig, you can provide a pub fn panic in your
root source file
alongside pub fn main. But if you do not provide this
function, the default
is used:
pub fn panic(msg: []const u8, error_return_trace: ?*builtin.StackTrace) noreturn {
    @setCold(true);
    switch (builtin.os) {
        builtin.Os.freestanding => {
            while (true) {}
        },
        else => {
            const first_trace_addr = @ptrToInt(@returnAddress());
            std.debug.panicExtra(error_return_trace, first_trace_addr, "{}", msg);
        },
    }
}
Here we can see why the code earlier is hanging - the default panic handler for the
freestanding target is simply while(true) {}.
So we can make an immediate improvement by creating our own panic handler:
pub fn panic(message: []const u8, stack_trace: ?*builtin.StackTrace) noreturn {
    serial.write("\n!KERNEL PANIC!\n");
    serial.write(message);
    serial.write("\n");
    while(true) {}
}
And now, the output of booting the Raspberry Pi:
Hello World! ClashOS 0.0

!KERNEL PANIC!
integer overflow
Already this is much better. We can see that an integer overflow caused a kernel panic. But an integer overflow could occur anywhere. Wouldn't it be nice to have a full stack trace printed?
Yes, yes it would. The first thing I needed to make this work is access to the DWARF debugging info from inside the kernel. But I don't even have a file system. How can that work?
Easy! Just put the DWARF info directly into the kernel's memory. I modified my linker script to do just that:
    .rodata : ALIGN(4K) {
        *(.rodata)
        __debug_info_start = .;
        KEEP(*(.debug_info))
        __debug_info_end = .;
        __debug_abbrev_start = .;
        KEEP(*(.debug_abbrev))
        __debug_abbrev_end = .;
        __debug_str_start = .;
        KEEP(*(.debug_str))
        __debug_str_end = .;
        __debug_line_start = .;
        KEEP(*(.debug_line))
        __debug_line_end = .;
        __debug_ranges_start = .;
        KEEP(*(.debug_ranges))
        __debug_ranges_end = .;
    }
And to my dismay, these error messages stared back at me:
lld: error: incompatible section flags for .rodata
>>> /home/andy/dev/clashos/zig-cache/clashos.o:(.debug_info): 0x0
>>> output section .rodata: 0x12

lld: error: incompatible section flags for .rodata
>>> <internal>:(.debug_str): 0x30
>>> output section .rodata: 0x12

lld: error: incompatible section flags for .rodata
>>> /home/andy/dev/clashos/zig-cache/clashos.o:(.debug_line): 0x0
>>> output section .rodata: 0x32
After a back and forth on a bug report, George Rimar suggested simply deleting that particular check, as it might have been an overly strict enforcement. I tried this in my LLD fork, and it worked! Debug information was now linked into my kernel images. After completing the rest of the steps in this blog post, I submitted a patch upstream, which Rui has already merged into LLD. This will be released with LLVM 8, and in the meantime Zig's LLD fork has the patch.
At this point it was a simple matter of writing the glue code between my kernel and the Zig Standard Library's stack trace facilities. In Zig, you don't have to intentionally support freestanding mode. Code which has no dependencies on a particular operating system will work in freestanding mode thanks to Zig's lazy top level declaration analysis. Because the standard library stack trace code does not call any OS API, it therefore supports freestanding mode.
The Zig std lib API for opening debug information from an ELF file looks like this:
pub fn openElfDebugInfo(
    allocator: *mem.Allocator,
    elf_seekable_stream: *DwarfSeekableStream,
    elf_in_stream: *DwarfInStream,
) !DwarfInfo
But this kernel is so bare bones, it's not even in an ELF file. It's booting directly from a binary blob. We just have the debug info sections mapped directly into memory. For that we can use a lower level API:
/// Initialize DWARF info. The caller has the responsibility to initialize most
/// the DwarfInfo fields before calling. These fields can be left undefined:
/// * abbrev_table_list
/// * compile_unit_list
pub fn openDwarfDebugInfo(di: *DwarfInfo, allocator: *mem.Allocator) !void
And DwarfInfo is defined like this:
pub const DwarfInfo = struct {
    dwarf_seekable_stream: *DwarfSeekableStream,
    dwarf_in_stream: *DwarfInStream,
    endian: builtin.Endian,
    debug_info: Section,
    debug_abbrev: Section,
    debug_str: Section,
    debug_line: Section,
    debug_ranges: ?Section,
    abbrev_table_list: ArrayList(AbbrevTableHeader),
    compile_unit_list: ArrayList(CompileUnit),
};
To hook these up, the glue code needs to initialize the fields of
DwarfInfo with the offsets into a
std.io.SeekableStream, which can
be implemented as a simple pointer to memory. By declaring external variables
and then looking at their addresses, we can find out where in memory the symbols
defined in the linker script are.
For .debug_abbrev, .debug_str, and .debug_ranges, I had to
set the offset to 0 to
workaround
LLD thinking that the sections start at 0 for some reason.
var kernel_panic_allocator_bytes: [100 * 1024]u8 = undefined;
var kernel_panic_allocator_state = std.heap.FixedBufferAllocator.init(kernel_panic_allocator_bytes[0..]);
const kernel_panic_allocator = &kernel_panic_allocator_state.allocator;

extern var __debug_info_start: u8;
extern var __debug_info_end: u8;
extern var __debug_abbrev_start: u8;
extern var __debug_abbrev_end: u8;
extern var __debug_str_start: u8;
extern var __debug_str_end: u8;
extern var __debug_line_start: u8;
extern var __debug_line_end: u8;
extern var __debug_ranges_start: u8;
extern var __debug_ranges_end: u8;

fn dwarfSectionFromSymbolAbs(start: *u8, end: *u8) std.debug.DwarfInfo.Section {
    return std.debug.DwarfInfo.Section{
        .offset = 0,
        .size = @ptrToInt(end) - @ptrToInt(start),
    };
}

fn dwarfSectionFromSymbol(start: *u8, end: *u8) std.debug.DwarfInfo.Section {
    return std.debug.DwarfInfo.Section{
        .offset = @ptrToInt(start),
        .size = @ptrToInt(end) - @ptrToInt(start),
    };
}

fn getSelfDebugInfo() !*std.debug.DwarfInfo {
    const S = struct {
        var have_self_debug_info = false;
        var self_debug_info: std.debug.DwarfInfo = undefined;

        var in_stream_state = std.io.InStream(anyerror){ .readFn = readFn };
        var in_stream_pos: usize = 0;
        const in_stream = &in_stream_state;

        fn readFn(self: *std.io.InStream(anyerror), buffer: []u8) anyerror!usize {
            const ptr = @intToPtr([*]const u8, in_stream_pos);
            @memcpy(buffer.ptr, ptr, buffer.len);
            in_stream_pos += buffer.len;
            return buffer.len;
        }

        const SeekableStream = std.io.SeekableStream(anyerror, anyerror);
        var seekable_stream_state = SeekableStream{
            .seekToFn = seekToFn,
            .seekForwardFn = seekForwardFn,

            .getPosFn = getPosFn,
            .getEndPosFn = getEndPosFn,
        };
        const seekable_stream = &seekable_stream_state;

        fn seekToFn(self: *SeekableStream, pos: usize) anyerror!void {
            in_stream_pos = pos;
        }
        fn seekForwardFn(self: *SeekableStream, pos: isize) anyerror!void {
            in_stream_pos = @bitCast(usize, @bitCast(isize, in_stream_pos) +% pos);
        }
        fn getPosFn(self: *SeekableStream) anyerror!usize {
            return in_stream_pos;
        }
        fn getEndPosFn(self: *SeekableStream) anyerror!usize {
            return @ptrToInt(&__debug_ranges_end);
        }
    };
    if (S.have_self_debug_info) return &S.self_debug_info;

    S.self_debug_info = std.debug.DwarfInfo{
        .dwarf_seekable_stream = S.seekable_stream,
        .dwarf_in_stream = S.in_stream,
        .endian = builtin.Endian.Little,
        .debug_info = dwarfSectionFromSymbol(&__debug_info_start, &__debug_info_end),
        .debug_abbrev = dwarfSectionFromSymbolAbs(&__debug_abbrev_start, &__debug_abbrev_end),
        .debug_str = dwarfSectionFromSymbolAbs(&__debug_str_start, &__debug_str_end),
        .debug_line = dwarfSectionFromSymbol(&__debug_line_start, &__debug_line_end),
        .debug_ranges = dwarfSectionFromSymbolAbs(&__debug_ranges_start, &__debug_ranges_end),
        .abbrev_table_list = undefined,
        .compile_unit_list = undefined,
    };
    try std.debug.openDwarfDebugInfo(&S.self_debug_info, kernel_panic_allocator);
    return &S.self_debug_info;
}
You can see that the Zig common practice of accepting an allocator as an argument when allocation is needed comes in extremely handy for kernel development. We simply statically allocate a 100 KiB buffer and pass that along as the debug info allocator. If this ever becomes too small, it can be adjusted.
And now it's just a matter of wiring up the panic function:
pub fn panic(message: []const u8, stack_trace: ?*builtin.StackTrace) noreturn {
    serial.log("\n!KERNEL PANIC! {}\n", message);
    const dwarf_info = getSelfDebugInfo() catch |err| {
        serial.log("unable to get debug info: {}\n", @errorName(err));
        hang();
    };
    const first_trace_addr = @ptrToInt(@returnAddress());
    var it = std.debug.StackIterator.init(first_trace_addr);
    while (it.next()) |return_address| {
        std.debug.printSourceAtAddressDwarf(
            dwarf_info,
            serial_out_stream,
            return_address,
            true, // tty color on
            printLineFromFile,
        ) catch |err| {
            serial.log("missed a stack frame: {}\n", @errorName(err));
            continue;
        };
    }
    hang();
}

fn hang() noreturn {
    while (true) {}
}

fn printLineFromFile(out_stream: var, line_info: std.debug.LineInfo) anyerror!void {
    serial.log("TODO print line from the file\n");
}
Here it is in action:
Hello World! ClashOS 0.0

!KERNEL PANIC! integer overflow
/home/andy/dev/clashos/src/main.zig:166:7: 0x15e0 in ??? (clashos)
TODO print line from the file
      ^
???:?:?: 0x1c in ??? (???)
Great progress.
That last line is coming from the startup assembly code, which has no source mapping. But we can see that it's correct, by looking at the disassembly of the kernel:
0000000000000000 <_start>:
       0:	d53800a0 	mrs	x0, mpidr_el1
       4:	d2b82001 	mov	x1, #0xc1000000
       8:	8a210000 	bic	x0, x0, x1
       c:	b4000040 	cbz	x0, 14 <master>
      10:	14000003 	b	1c <__hang>

0000000000000014 <master>:
      14:	b26503ff 	mov	sp, #0x8000000
      18:	9400054b 	bl	1544 <kernel_main>

000000000000001c <__hang>:
      1c:	d503205f 	wfe
      20:	17ffffff 	b	1c <__hang>
You can see that 0x1c is indeed the return address
(the next instruction that will be executed when the function returns)
of the function call to kernel_main.
Let's shuffle the code around into more files and make that trace longer.
Hello World! ClashOS 0.0

!KERNEL PANIC!
integer overflow
/home/andy/dev/clashos/src/serial.zig:42:7: 0x1b10 in ??? (clashos)
TODO print line from the file
      ^
/home/andy/dev/clashos/src/main.zig:58:16: 0x1110 in ??? (clashos)
TODO print line from the file
               ^
/home/andy/dev/clashos/src/main.zig:67:18: 0xecc in ??? (clashos)
TODO print line from the file
                 ^
???:?:?: 0x1c in ??? (???)
It's looking good. But can we add a cherry on top, and make it print the source lines?
Again we don't have a file system. How can the printLineFromFile function
have access to source files?
Sometimes the simplest solution is the best one. How about the kernel just has its own source code in memory?
That's really easy to hook up in Zig:
const source_files = [][]const u8{
    "src/debug.zig",
    "src/main.zig",
    "src/mmio.zig",
    "src/serial.zig",
};
fn printLineFromFile(out_stream: var, line_info: std.debug.LineInfo) anyerror!void {
    inline for (source_files) |src_path| {
        if (std.mem.endsWith(u8, line_info.file_name, src_path)) {
            const contents = @embedFile("../" ++ src_path);
            try printLineFromBuffer(out_stream, contents[0..], line_info);
            return;
        }
    }
    try out_stream.print("(source file {} not added in std/debug.zig)\n", line_info.file_name);
}
Here we take advantage of inline for
as well as @embedFile, and all the sudden
we can print lines of code from our own source files. printLineFromBuffer
left as an exercise for the reader.
So let's see that output again:
Hello World! ClashOS 0.0

!KERNEL PANIC!
integer overflow
/home/andy/dev/clashos/src/serial.zig:42:7: 0x1b10 in ??? (clashos)
    x += 1;
      ^
/home/andy/dev/clashos/src/main.zig:58:16: 0x1110 in ??? (clashos)
    serial.boom();
               ^
/home/andy/dev/clashos/src/main.zig:67:18: 0xecc in ??? (clashos)
    some_function();
                 ^
???:?:?: 0x1c in ??? (???)
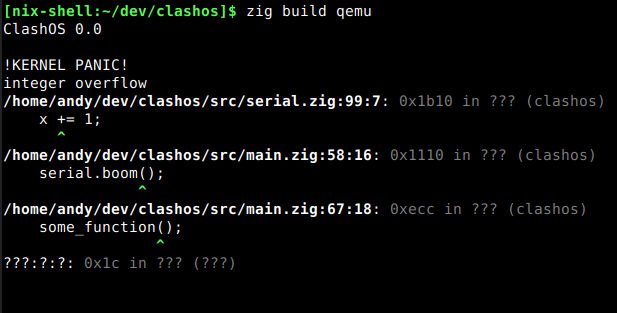
Beautiful. Here's a picture so you can see it with color:

And now all of the protections that Zig offers against undefined behavior will result in output like this.
Conclusion
One of my big goals with Zig is to improve the embedded and OS development process. I hope you're as excited as I am about the potential here.
If this blog post captured your interest, maybe you would like to check out this Hello World x86 Kernel, which comes with a video of me live coding it. Thanks to an insightful Twitch comment, it works with only Zig code, no assembly required.
The Zig Programming Language is crowd funded, and is not beholden to any business or set of businesses. Please consider supporting my work on Patreon.